
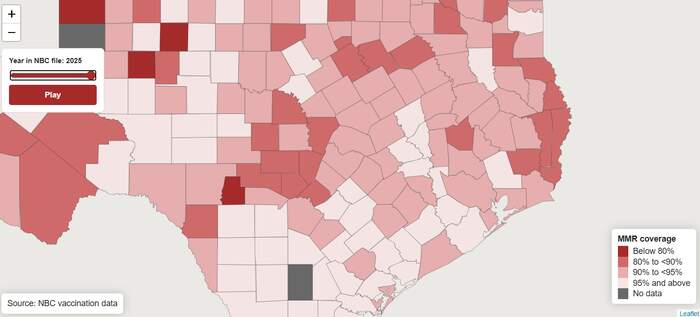
Kindergarten MMR vaccination coverage improved in Harris County during the 2025-26 school year, but rates across the Houston area have still not returned to where they were before the COVID-19 pandemic.
Following a measles outbreak in Montgomery County this summer, KPRC 2’s ENOUGH team looked at how kindergarten vaccination rates have changed across the Houston area over the last 12 years.
The Montgomery County outbreak came a year after 207 confirmed measles cases spread throughout West Texas.
As a follow-up to NBC’s 2025 series, The Vaccine Divide, ENOUGH used kindergarten measles, mumps, and rubella (MMR) vaccination rates in Harris, Brazoria, Fort Bend, Galveston, Montgomery, and Waller counties, based on Texas school immunization data shared by NBC.
Two counties improved. All six remain below pre-pandemic levels
Between the 2024-25 and 2025-26 school years, Harris County’s reported kindergarten MMR coverage increased by about 2 percentage points, the largest one-year increase among the six counties reviewed.
Waller County also improved, with its rate increasing by about 0.6 percentage points.
Rates declined in Brazoria, Fort Bend, Galveston and Montgomery counties.
But even where coverage improved, none of the six counties had returned to its 2019-20 rate.
Harris County recorded the largest decline compared with 2019-20, down 3.84 percentage points. Waller County had the smallest decrease over the same period, down 1.77 percentage points.
The data show a mixed picture: Some counties are making up ground, but kindergarten MMR coverage across the Houston area remains below where it stood before the pandemic.
See how your county’s rate changed
Use the interactive map below to explore reported kindergarten MMR vaccination coverage across Texas from 2014 through 2025.
Press play to watch vaccination rates change over time, or use the slider to select a school year. Click a county to see its reported MMR coverage for that year.
Darker red counties indicate lower reported vaccination coverage.
Gray means the dataset does not include a reported rate for that county and school year.
About the data
The figures come from the Texas Department of State Health Services’ annual school immunization survey.
Schools report their own data, and participation can vary from year to year. The percentages represent kindergarten students at schools that submitted immunization data to the state.
Because reporting participation can change, the figures should be read as reported coverage among participating schools rather than a complete count of every kindergarten student in a county.


